👋 Hi, this is Gergely with a subscriber-only issue of the Pragmatic Engineer Newsletter. In every issue, I cover challenges at Big Tech and startups through the lens of engineering managers and senior engineers. If you’ve been forwarded this email, you can subscribe here. How Shopify Built Its Live Globe for Black FridayShopify has built a surprisingly fun and engaging Black Friday / Cyber Monday visual tracker, simulating a spaceship's interior. A deepdive in how this experience was built with the dev team behind itBlack Friday and Cyber Monday (jointly known as “BFCM”) are when e-commerce businesses make the most money in the year: up to 10x more than any other day. Obviously, this means the period is extremely important for:
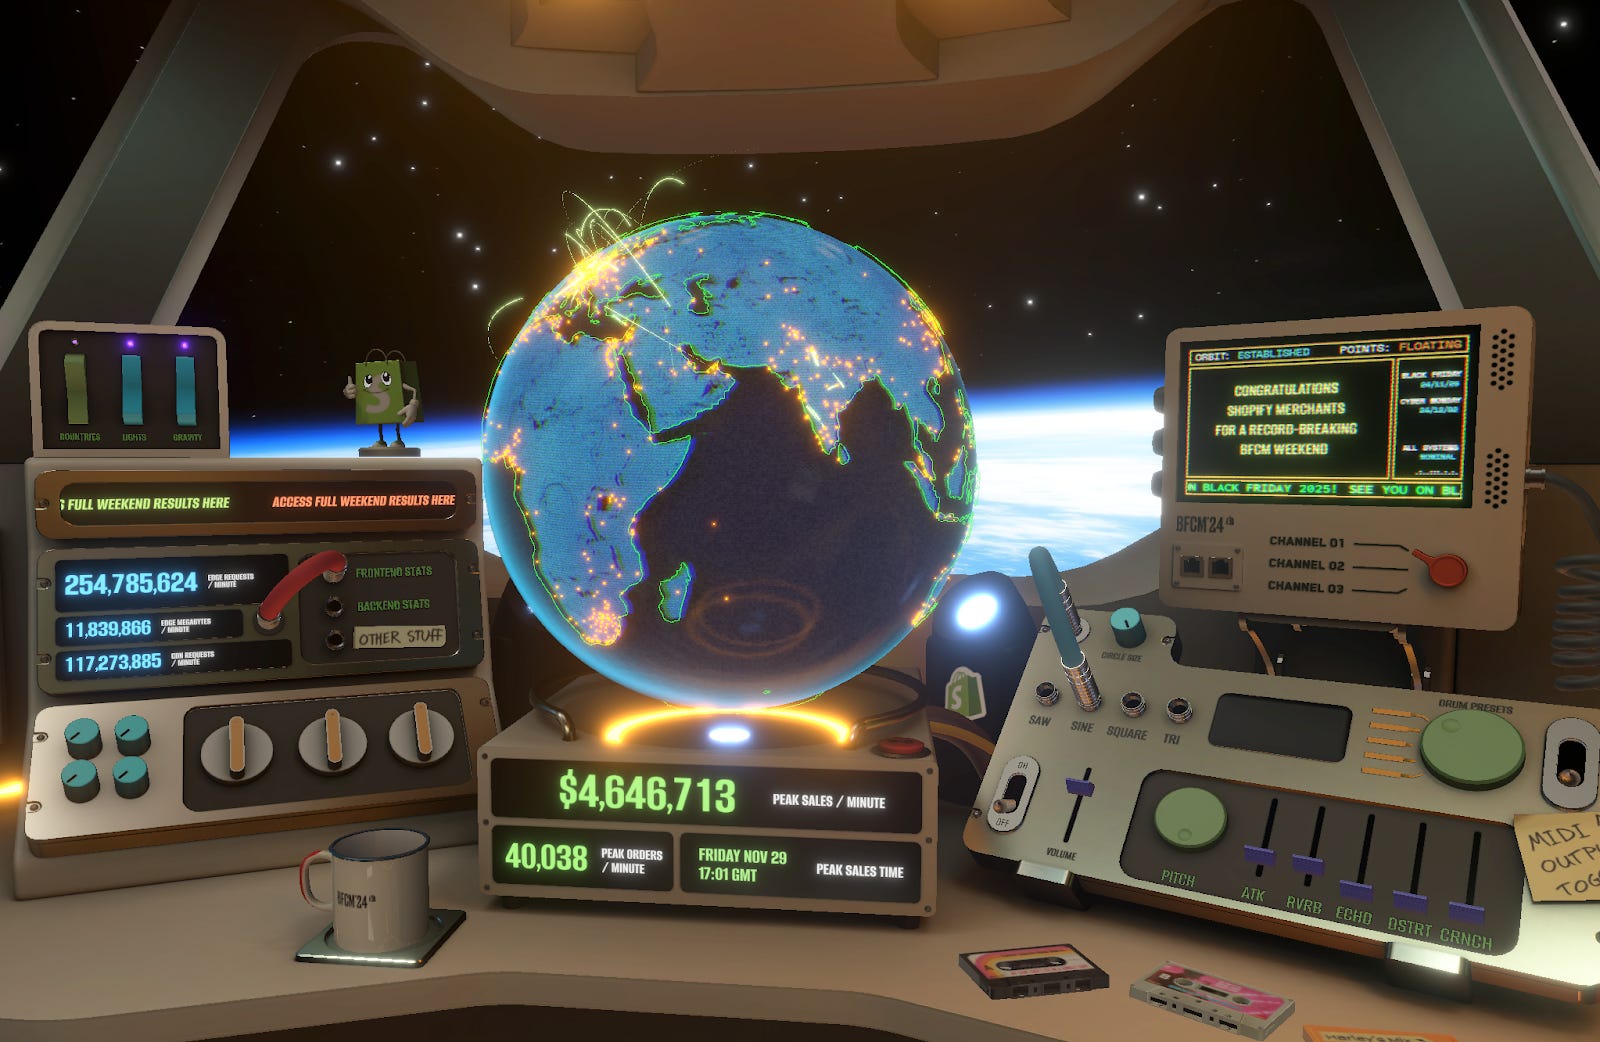
Shopify is one of the biggest challengers in the e-commerce segment, and is unusually transparent about what happens on its platform on BFCM. For a few years now, the company has made a special “Black Friday Cyber Monday” portal for anyone to inspect, and the latest one is a pretty mesmerizing visual experience: in real time, you can inspect sales and software engineering stats like database queries and edge requests per minute, in a fun, interactive spaceship environment.
I reached out to Shopify to find out how they built their interactive dashboard. We talked with BFCM tech lead, Daniel Beauchamp, and head of engineering, Farhan Thawar, who shared plenty of new details. This article covers:
Check out related articles:
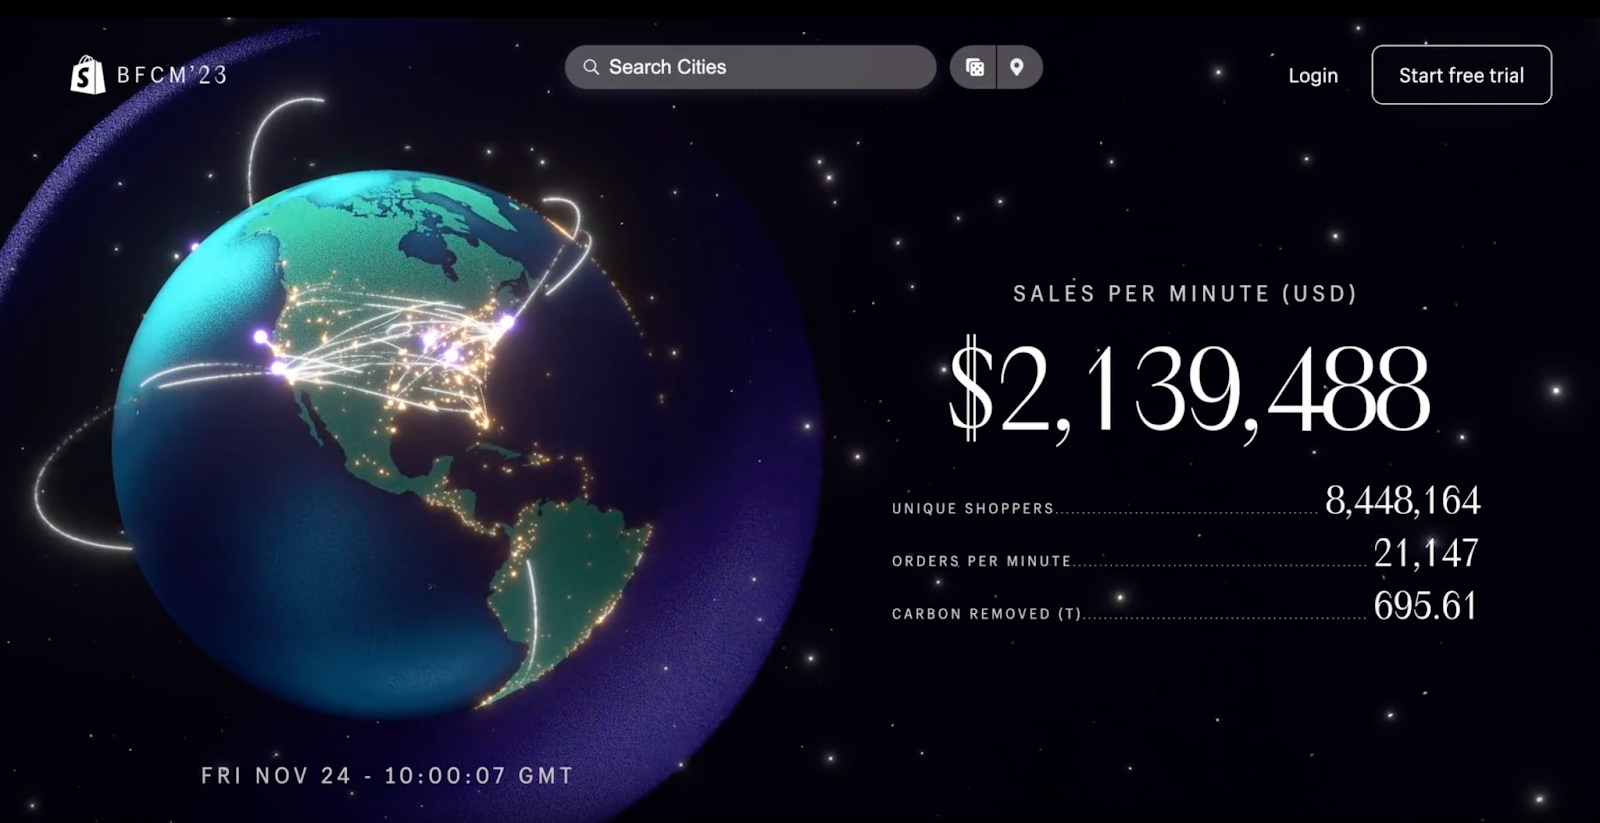
The bottom of this article could be cut off in some email clients. Read the full article uninterrupted, online. With that, let’s jump in: 1. KickoffShopify has been running an internal Black Friday / Cyber Monday live dashboard since 2014. Initially, it served as a way to track what was happening on important days for the business. And since 2018, the company has made a version of its “Globe” available to the world Here’s what the 2023 version looked like: The Shopify team previously shared details on how they built the 2023 version. Daniel Beauchamp is a principal engineer for AR/VR at Shopify, and has headed the Live Globe project for the past few years. He says that this time, they wanted to make it more special than ever:
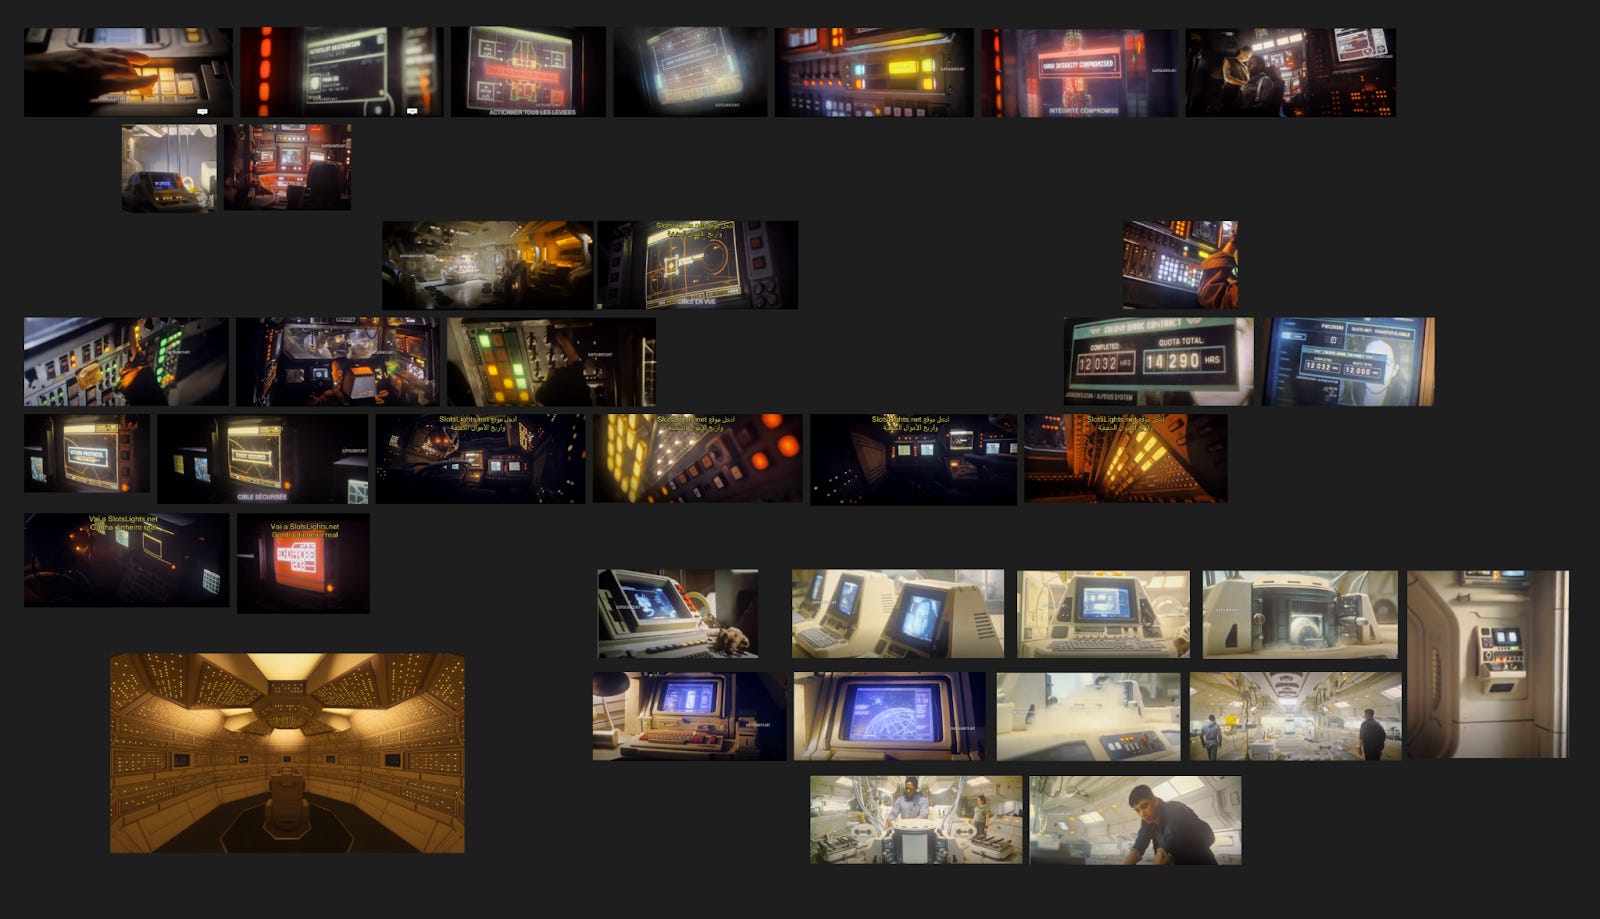
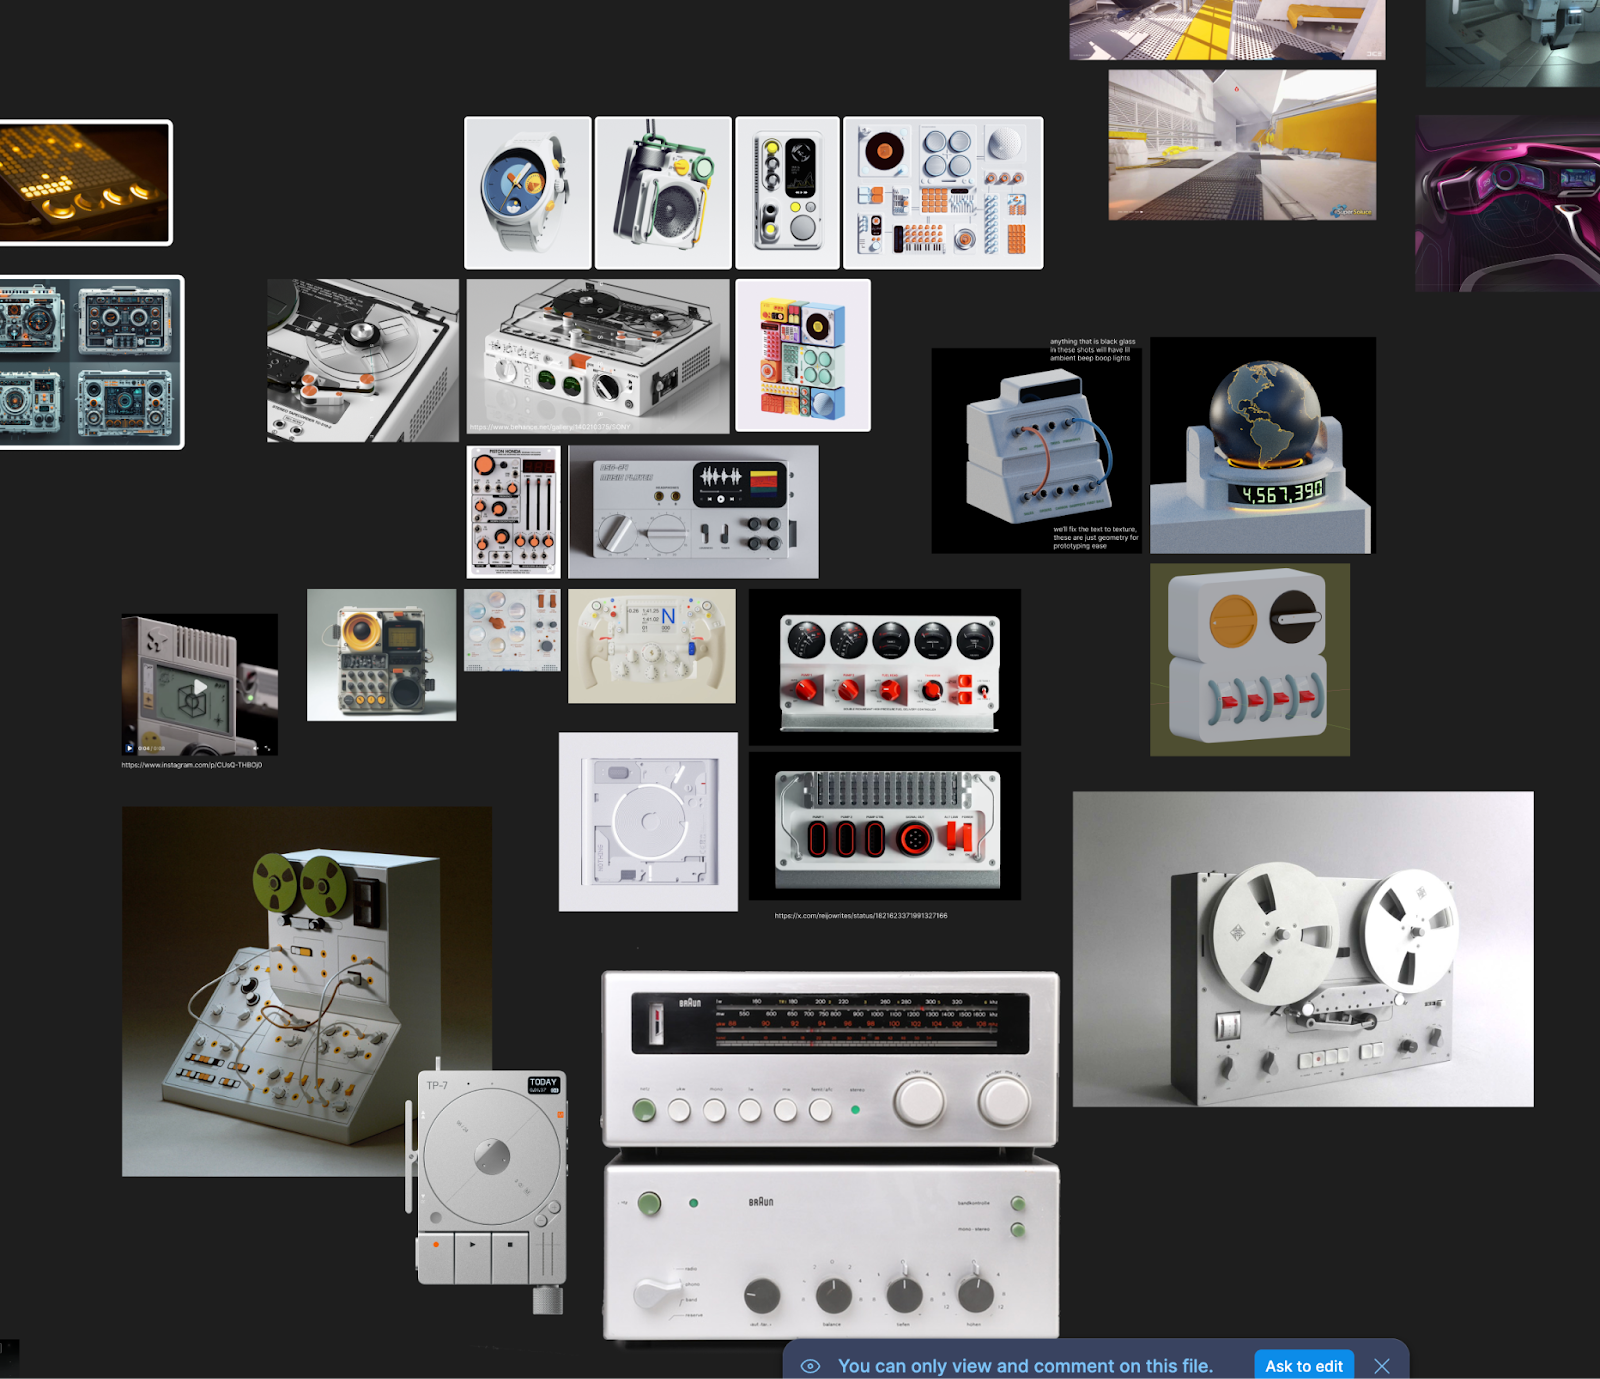
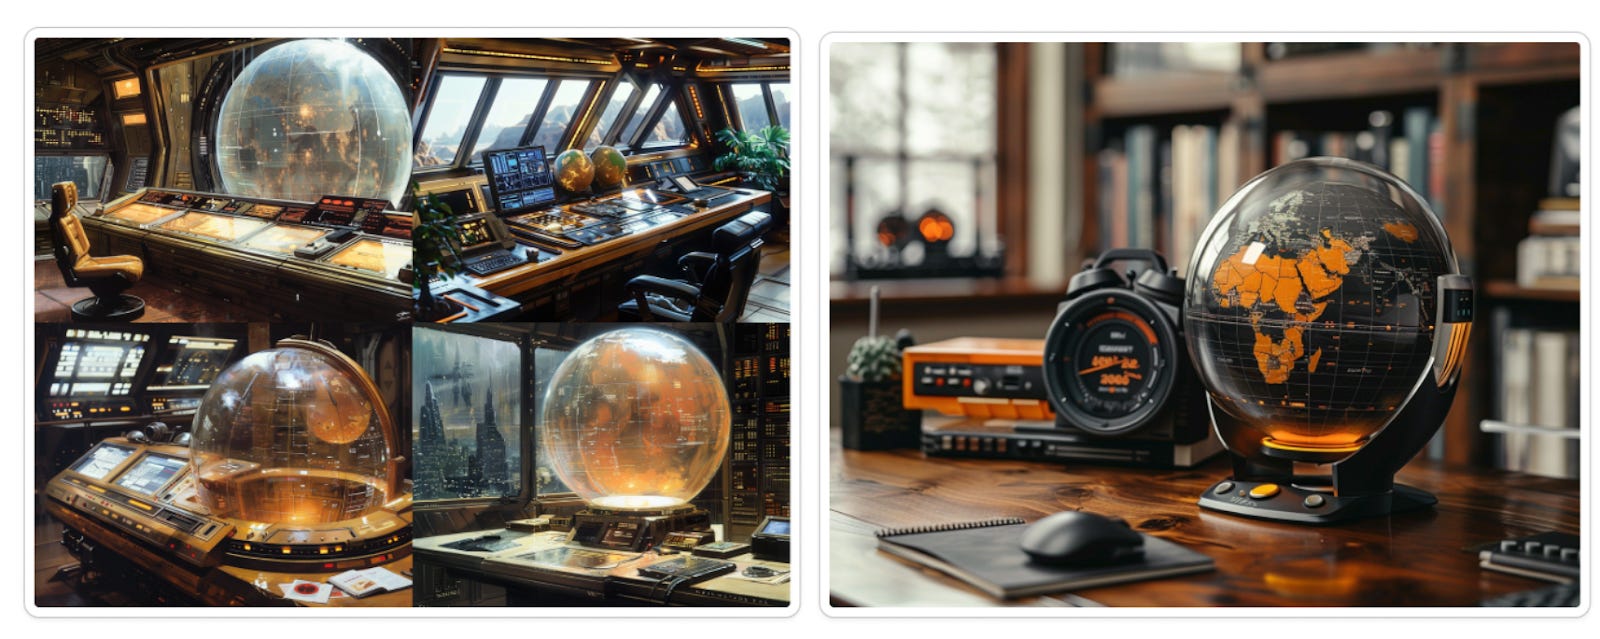
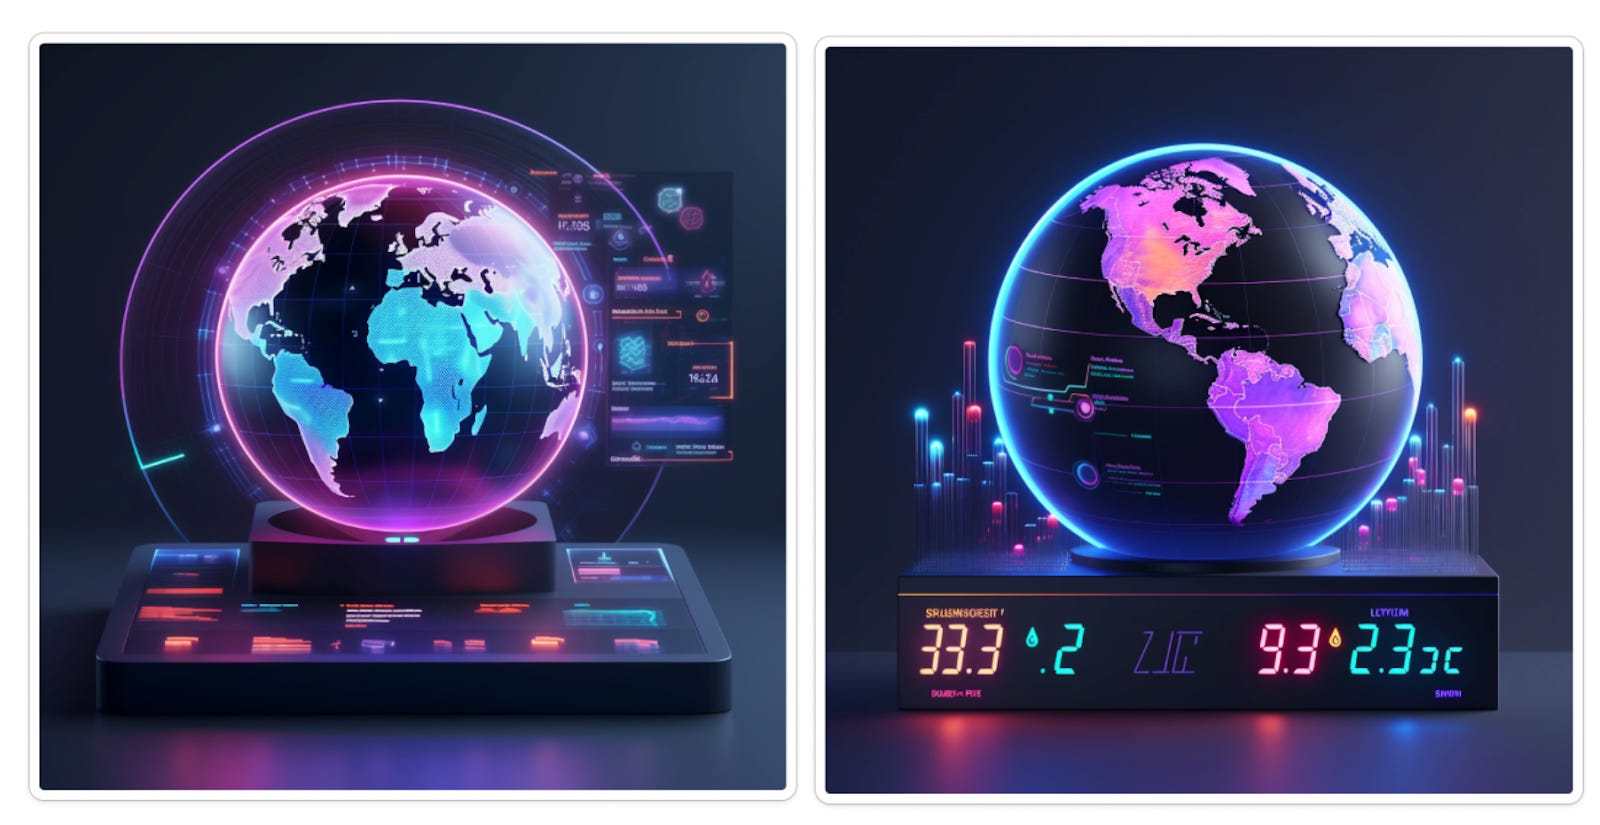
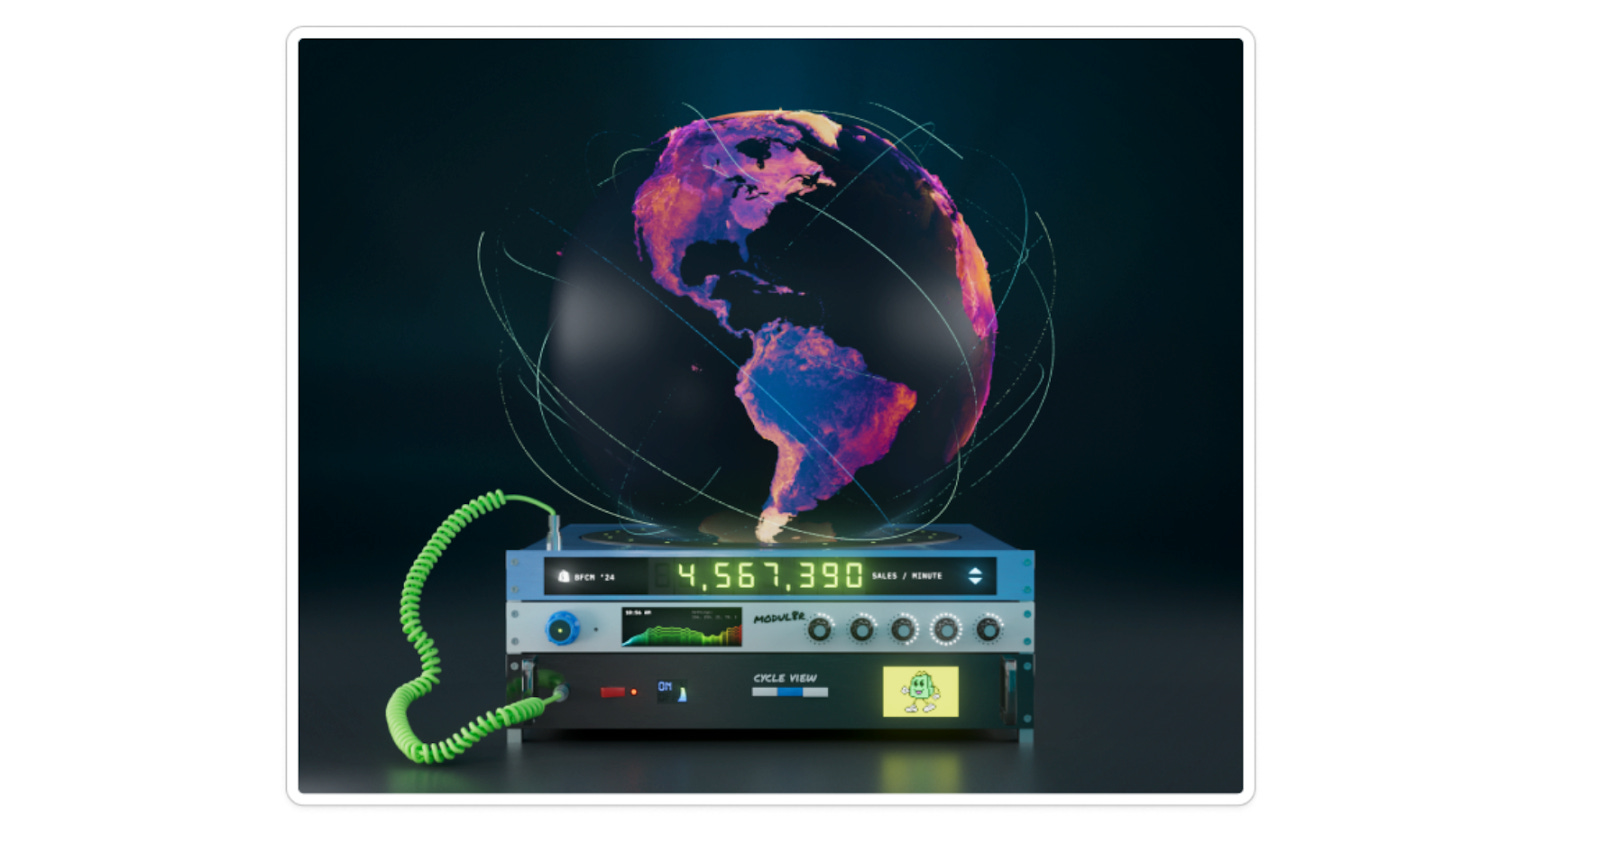
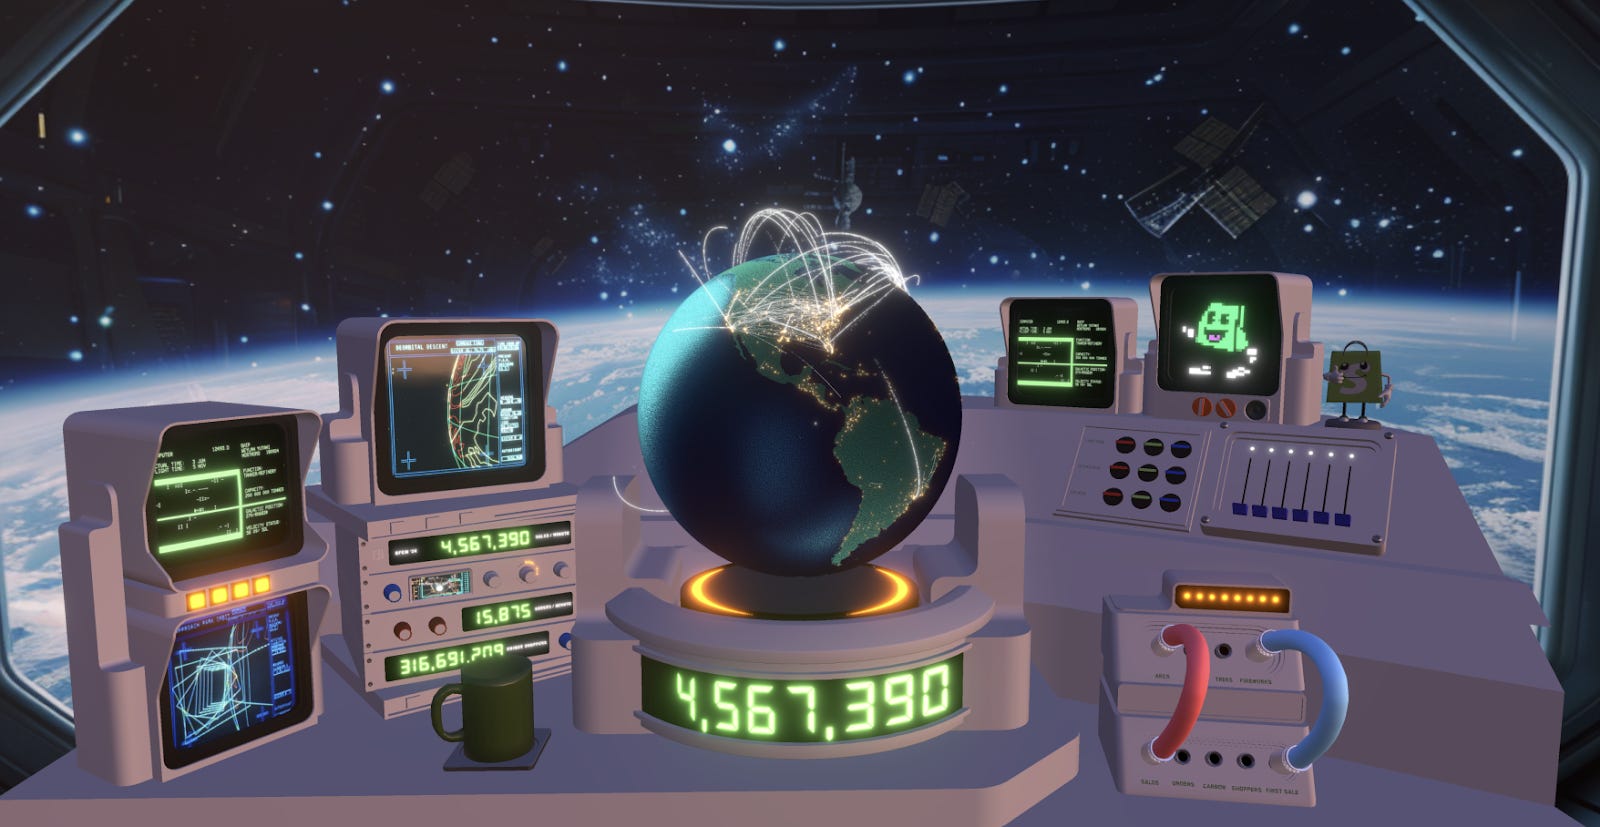
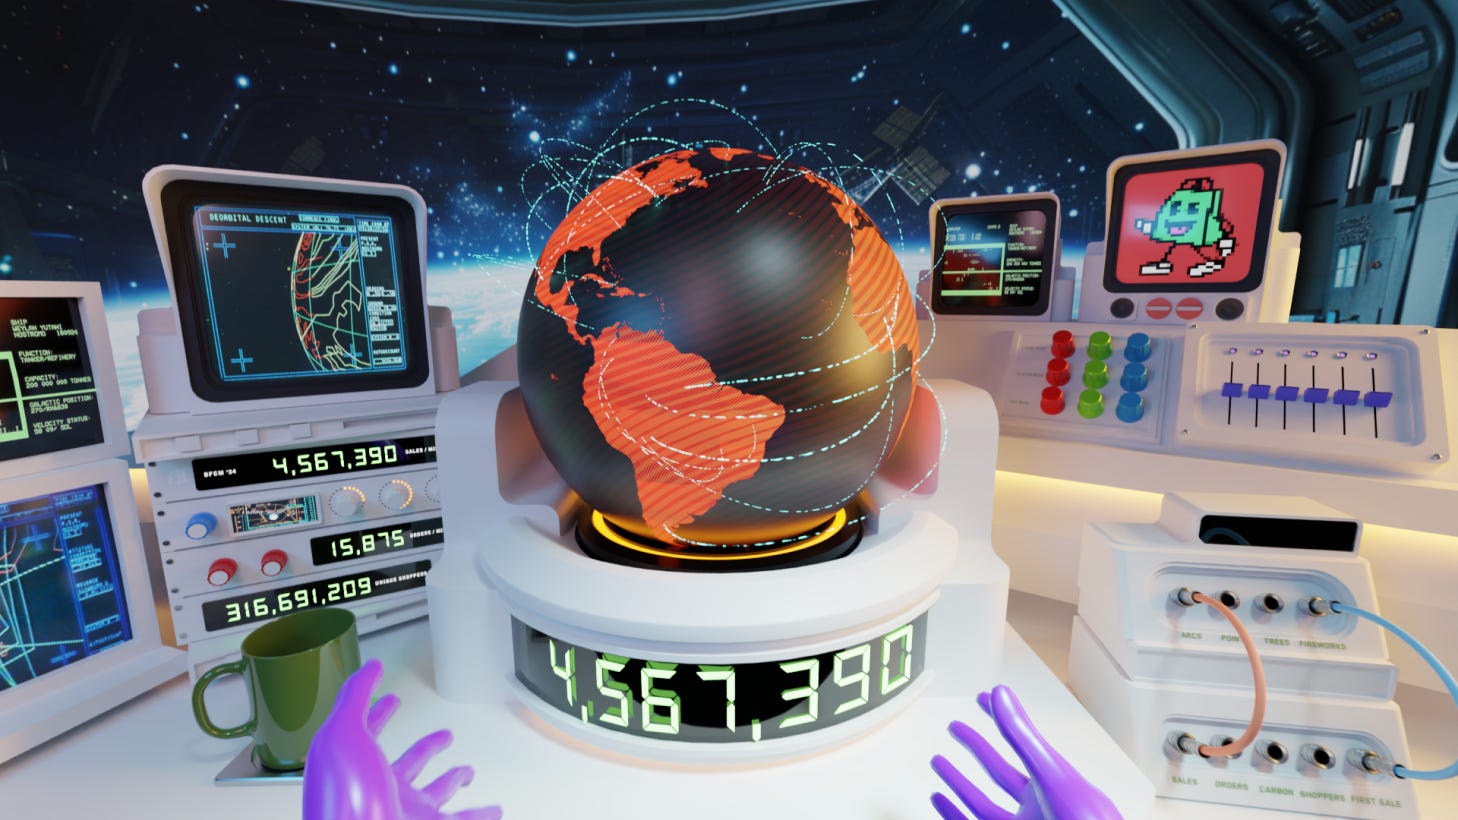
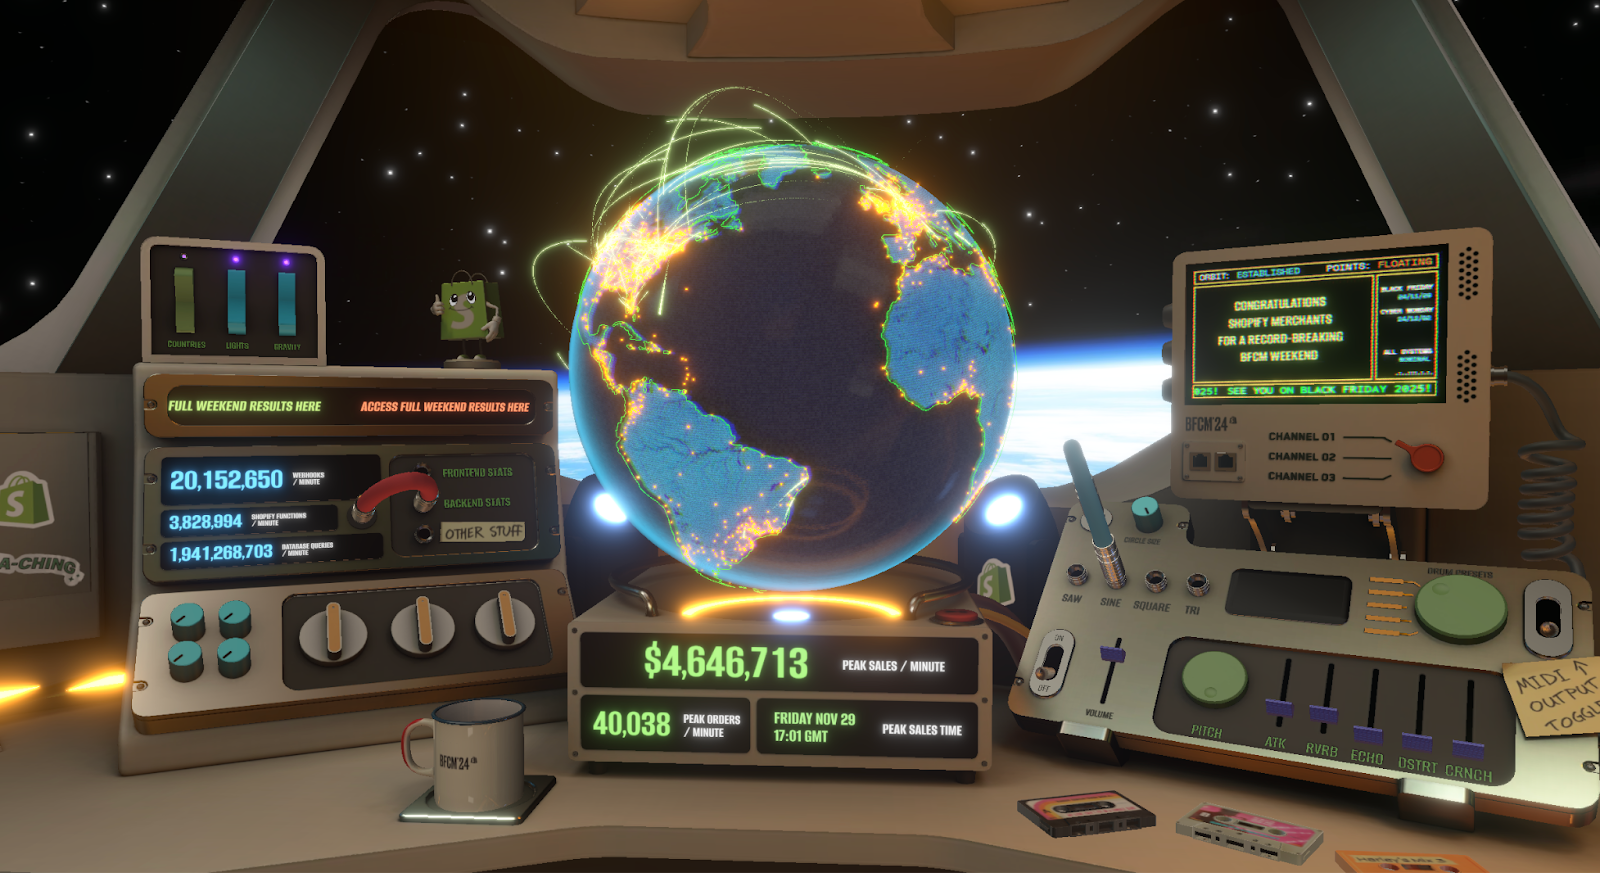
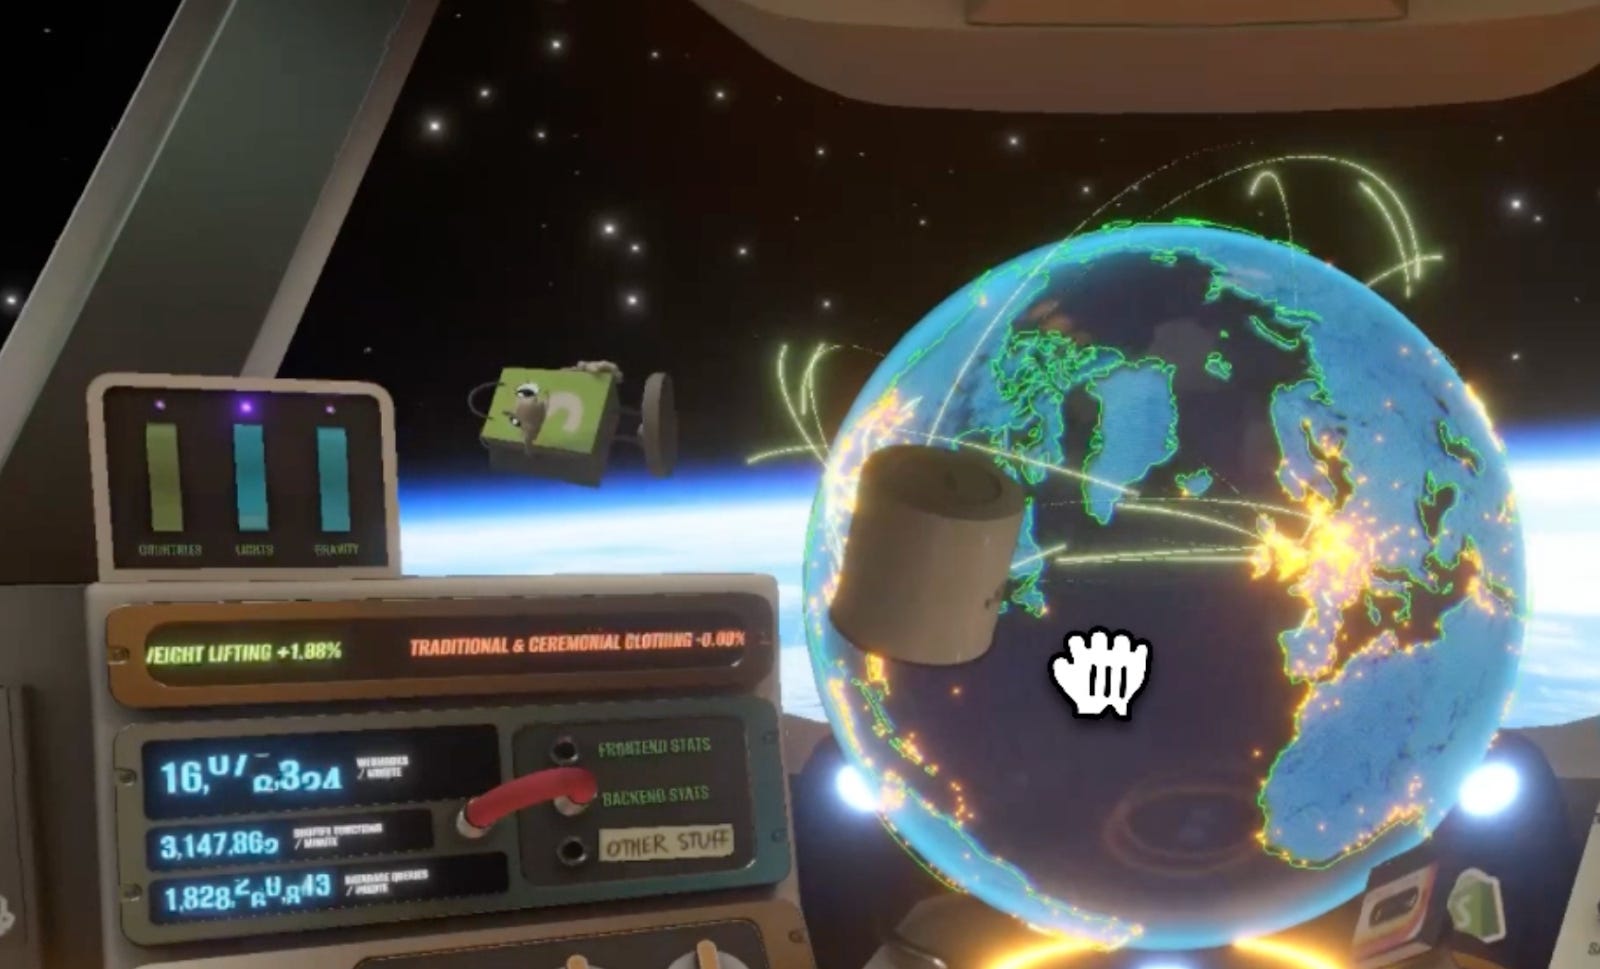
With 6 people and 2 months to achieve that this year, the site was rebuilt from scratch. The team consisted of two software engineers, one 3D artist, and three data engineers, plus a few folks helping out with SEO and some design/logo work. 2. Design processThe Live Globe works very well from a user’s point of view because it’s visually appealing, set inside a spaceship near a cabin window. So how was this project designed? Daniel – the project lead – has a long interest in 3D games and programming, and became the go-to person for all things 3D at Shopify. In 2015, he launched an augmented reality (AR) team in the company. The team’s mission was to make Shopify spatially enabled, and enable merchants to use 3D, VR, or AR. It was natural for this team to be involved in the initial versions of Live Globe, and they drive major updates for the project. InspirationAs a start, the team explored different concepts of globes and futuristic environments, merged with retro car dashboards. They collected dashboards and panels from the interiors of spaceships in the Alien movie franchise: There were also futuristic, functional engineering concepts by hardware maker Teenage Engineering, and designer, Peter Tarka: AI concept art was also employed, using image generation models to create graphics for the creative process: And some concept art for the UI was AI-generated: PrototypingThen the team started creating 3D model prototypes. During this phase, they had to figure out two things: #1: Appearance of the Globe. As the centerpiece of the experience, it matters what the globe looks like. Here are some prototypes of the globe and its environment: The team spent a lot of time honing the appearance. The globe has a glass-like visage and oscilloscopic lines. Initially, the team added topological features, but those didn’t make the final version. #2: Environment and interactions. With the globe design finalized, the next challenge was to create the environment it exists in, and figure out what visitors could do beyond interacting with the globe. Prototype versions of the environment: And here’s what one of the final prototypes looked like: The prototypes had a lot of detail, much of which ended up being stripped out. When prototyping, the team wanted to see how much they could cram into the user interface and what that was like for users. During the development process, the team removed details that were distracting, like too many wires, screens or buttons, and parts with no function. After plenty of refinement, they achieved the final design: 3. StatsThe functional goal of the site was to share real time statistics on the load that Shopify’s platform was handling during BFCM. Below are some numbers from that weekend. Business stats
Infra numbersHere are some peak load figures that might interest engineers:
These numbers are truly impressive and require significant infrastructure to serve reliably. It’s safe to assume they set new records at Shopify. It’s also safe to assume they might become “business as usual” if the platform keeps growing. Live Globe statsFinally, I asked the Live Globe team about stats on the microsite that updated in real time during BFCM. Some details:
Compared to the Shopify platform, the load on Live Globe was trivial; the challenge was not in keeping up with demand, it was building all the features on time and ensuring the data was streamed in as close to real time as possible. 4. System architecture...Subscribe to The Pragmatic Engineer to unlock the rest.Become a paying subscriber of The Pragmatic Engineer to get access to this post and other subscriber-only content. A subscription gets you:
|
Search thousands of free JavaScript snippets that you can quickly copy and paste into your web pages. Get free JavaScript tutorials, references, code, menus, calendars, popup windows, games, and much more.
How Shopify Built Its Live Globe for Black Friday
Subscribe to:
Post Comments (Atom)
Mainstream Is Now Fringe, and Fringe Is Mainstream
The current state of media is total anarchy ͏ ͏ ͏ ͏ ͏ ͏ ͏ ͏ ͏ ͏ ͏ ͏ ͏ ͏ ...
-
code.gs // 1. Enter sheet name where data is to be written below var SHEET_NAME = "Sheet1" ; // 2. Run > setup // // 3....




No comments:
Post a Comment